神奇的反转技术pdf下载(英文版)
时间:2016-06-20 13:25 来源:未知 作者:股窜网 阅读:次
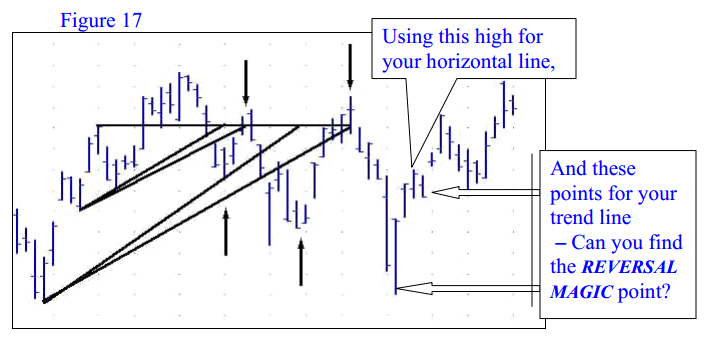
In all these cases, the horizontal line is drawn off of a high point that is between each
trend line’s two points.

How many bullish trend line triangles can you locate and where are the REVERSAL
MAGIC points?
As you can see, you have a choice of both bearish and bullish triangles on any given
chart. In fact, if you are not careful, you can literally overload your chart with so many
triangles that you can no longer see the price bars. So in order to control this overpopulation of lines, only keep the triangles that will affect you in the future. Delete all
past triangles. Also, don’t draw any more than necessary. You will find that a number of
these triangles will overlap at the very same point. So if you already have a REVERSAL
MAGIC point marked, don’t mark it again.
So which are better, bullish or bearish triangles? Both are equally important, and I
personally would not want to do without either because one will point to a REVERSAL
MAGIC point that the other does not. So be careful about becoming bias toward one
type. Learn to use both as effectively.
Take a look at figures 18 and 19. Both charts show IBM of the same year. Notice that
both bearish and bullish triangles are used successfully to locate the REVERSAL
MAGIC points.
神奇的反转技术下载地址:https://yunpan.cn/cmCaT8mZRZAUP 访问密码 b2c3
trend line’s two points.

How many bullish trend line triangles can you locate and where are the REVERSAL
MAGIC points?
As you can see, you have a choice of both bearish and bullish triangles on any given
chart. In fact, if you are not careful, you can literally overload your chart with so many
triangles that you can no longer see the price bars. So in order to control this overpopulation of lines, only keep the triangles that will affect you in the future. Delete all
past triangles. Also, don’t draw any more than necessary. You will find that a number of
these triangles will overlap at the very same point. So if you already have a REVERSAL
MAGIC point marked, don’t mark it again.
So which are better, bullish or bearish triangles? Both are equally important, and I
personally would not want to do without either because one will point to a REVERSAL
MAGIC point that the other does not. So be careful about becoming bias toward one
type. Learn to use both as effectively.
Take a look at figures 18 and 19. Both charts show IBM of the same year. Notice that
both bearish and bullish triangles are used successfully to locate the REVERSAL
MAGIC points.
神奇的反转技术下载地址:https://yunpan.cn/cmCaT8mZRZAUP 访问密码 b2c3
上一篇:K线金印组合交易秘诀pdf下载
下一篇:新短线英雄pdf下载/只铁
资料下载地址
http:pan.baidu/s/1EkJQdk8vsCCvbu71EthH2g
若下载链接失效,请与站长微信反馈:1691320917 更换最新下载链接 本站所提供的资料源自网络收集仅供学习,请勿用于商业用途。如果感觉不错,请到正规书店购买正版书籍

热门阅读

最新内容
推荐图文
- 趋势书籍推荐(10本)
做为技术交易者,做股票的第一要务就是看趋势、顺势而为,只有这...
- 股票画线技术入门与技巧
股票画线技术入门与技巧/刘振清pdf下载 出版社名称: 中国宇航出...
- 股市聊聊吧2015版(上下
股市聊聊吧2015版pdf下载 作者:廖英强 提前制定操盘计划 无论是...
- 历史上必读的十本投资书
一、大作手回忆录 作者简介:杰西利弗莫尔,有史以来最伟大的股...
相关内容

